- 1 Introduction
- 2 The Black Country 2039: Spatial Vision, Strategic Objectives and Strategic Priorities
- 3 Spatial Strategy
- 4 Infrastructure & Delivery
- 5 Health and Wellbeing
- 6 Housing
- 7 The Black Country Economy
- 8 The Black Country Centres
- 9 Transport
- 10 Environmental Transformation and Climate Change
- 11 Waste
- 12 Minerals
- 1 Sub-Areas and Site Allocations
- 2 Delivery, Monitoring, and Implementation
- 3 Appendix – changes to Local Plans
- 4 Appendix – Centres
- 5 Appendix – Black Country Plan Housing Trajectory
- 6 Appendix – Nature Recovery Network
- 7 Appendix – Glossary (to follow)

Draft Black Country Plan
(3) 5 Appendix – Black Country Plan Housing Trajectory
1) Draft Black Country Plan Housing Supply
|
Projected Completions (net homes) |
Dudley |
Sandwell |
Walsall |
Wolverhampton |
Black Country |
|
2020/21 |
730 |
619 |
146 |
1177 |
2672 |
|
2021/22 |
730 |
346 |
996 |
1141 |
3213 |
|
2022/23 |
730 |
513 |
1094 |
1019 |
3356 |
|
2023/24 |
907 |
620 |
935 |
949 |
3411 |
|
2024/25 |
912 |
606 |
928 |
392 |
2838 |
|
2025/26 |
659 |
607 |
874 |
681 |
2821 |
|
2026/27 |
668 |
443 |
919 |
572 |
2602 |
|
2027/28 |
685 |
377 |
1418 |
572 |
3052 |
|
2028/29 |
679 |
436 |
728 |
573 |
2416 |
|
2029/30 |
682 |
444 |
562 |
522 |
2210 |
|
2030/31 |
677 |
498 |
627 |
477 |
2279 |
|
2031/32 |
649 |
544 |
637 |
477 |
2307 |
|
2032/33 |
638 |
442 |
567 |
477 |
2124 |
|
2033/34 |
676 |
418 |
585 |
478 |
2157 |
|
2034/35 |
695 |
409 |
520 |
468 |
2092 |
|
2035/36 |
674 |
492 |
457 |
531 |
2154 |
|
2036/37 |
637 |
514 |
457 |
531 |
2139 |
|
2037/38 |
635 |
474 |
457 |
531 |
2097 |
|
2038/39 |
572 |
356 |
437 |
532 |
1897 |
|
Total |
13235 |
9158 |
13344 |
12100 |
47837 |
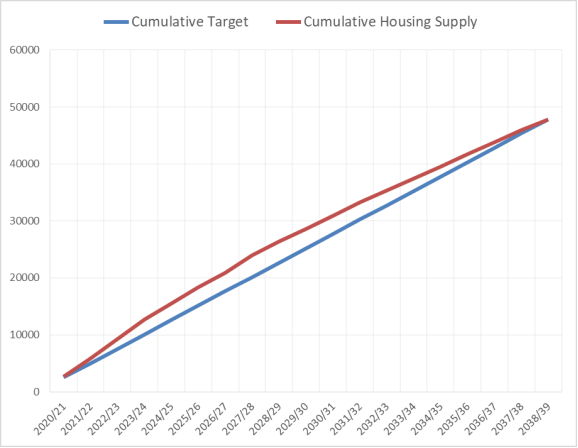
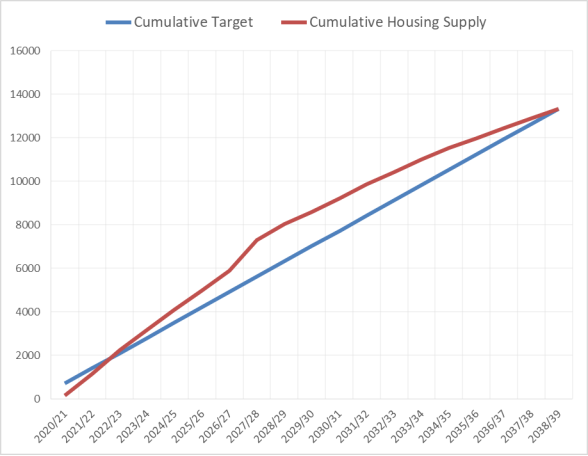
2) Black Country Housing Trajectory
|
Year |
Draft Black Country Plan Housing Supply (net) |
Draft Black Country Plan Housing Target (net) |
Cumulative Housing Supply |
Cumulative Target |
Annual target taking account of past supply |
Variation from Cumulative Target |
|
2020/21 |
2672 |
2518 |
2672 |
2518 |
2509 |
-154 |
|
2021/22 |
3213 |
2518 |
5885 |
5036 |
2468 |
-850 |
|
2022/23 |
3356 |
2518 |
9242 |
7553 |
2412 |
-1688 |
|
2023/24 |
3411 |
2518 |
12653 |
10071 |
2346 |
-2582 |
|
2024/25 |
2838 |
2518 |
15491 |
12589 |
2310 |
-2902 |
|
2025/26 |
2821 |
2518 |
18312 |
15107 |
2271 |
-3206 |
|
2026/27 |
2602 |
2518 |
20914 |
17624 |
2244 |
-3290 |
|
2027/28 |
3052 |
2518 |
23965 |
20142 |
2170 |
-3823 |
|
2028/29 |
2416 |
2518 |
26381 |
22660 |
2146 |
-3721 |
|
2029/30 |
2210 |
2518 |
28591 |
25178 |
2139 |
-3413 |
|
2030/31 |
2279 |
2518 |
30870 |
27695 |
2121 |
-3174 |
|
2031/32 |
2307 |
2518 |
33176 |
30213 |
2094 |
-2963 |
|
2032/33 |
2124 |
2518 |
35300 |
32731 |
2090 |
-2569 |
|
2033/34 |
2157 |
2518 |
37457 |
35249 |
2076 |
-2208 |
|
2034/35 |
2092 |
2518 |
39549 |
37766 |
2072 |
-1782 |
|
2035/36 |
2154 |
2518 |
41703 |
40284 |
2045 |
-1419 |
|
2036/37 |
2139 |
2518 |
43842 |
42802 |
1998 |
-1040 |
|
2037/38 |
2097 |
2518 |
45939 |
45320 |
1898 |
-620 |
|
2038/39 |
1897 |
2518 |
47837 |
47837 |
1 |
1 |
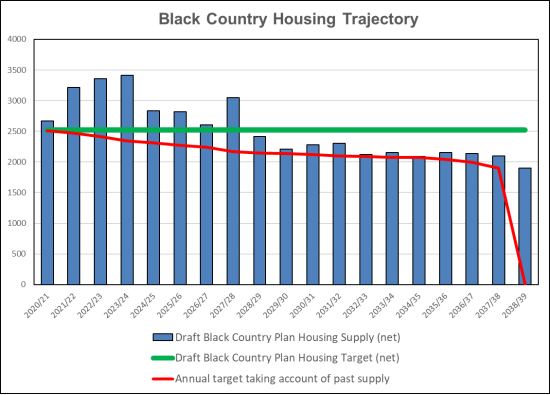
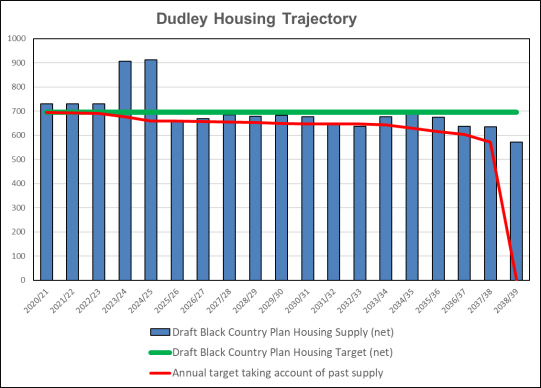
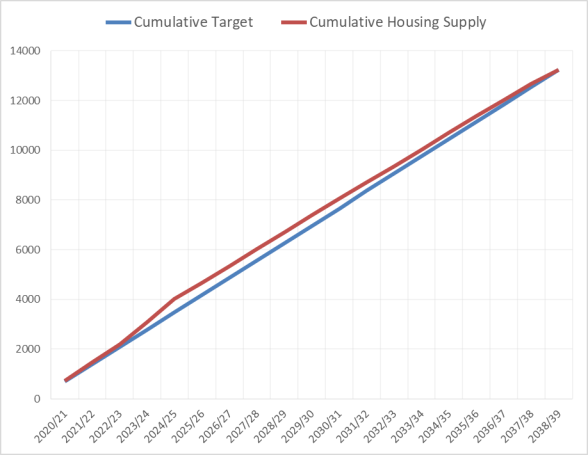
3) Dudley Housing Trajectory
|
Year |
Draft Black Country Plan Housing Supply (net) |
Draft Black Country Plan Housing Target (net) |
Cumulative Housing Supply |
Cumulative Target |
Annual target taking account of past supply |
Variation from Cumulative Target |
|
2020/21 |
730 |
697 |
730 |
697 |
695 |
-33 |
|
2021/22 |
730 |
697 |
1460 |
1393 |
693 |
-67 |
|
2022/23 |
730 |
697 |
2190 |
2090 |
690 |
-100 |
|
2023/24 |
907 |
697 |
3097 |
2786 |
676 |
-311 |
|
2024/25 |
912 |
697 |
4009 |
3483 |
659 |
-526 |
|
2025/26 |
659 |
697 |
4668 |
4180 |
659 |
-488 |
|
2026/27 |
668 |
697 |
5336 |
4876 |
658 |
-460 |
|
2027/28 |
685 |
697 |
6021 |
5573 |
656 |
-448 |
|
2028/29 |
679 |
697 |
6700 |
6269 |
654 |
-431 |
|
2029/30 |
682 |
697 |
7382 |
6966 |
650 |
-416 |
|
2030/31 |
677 |
697 |
8059 |
7663 |
647 |
-396 |
|
2031/32 |
649 |
697 |
8708 |
8359 |
647 |
-349 |
|
2032/33 |
638 |
697 |
9346 |
9056 |
648 |
-290 |
|
2033/34 |
676 |
697 |
10022 |
9752 |
643 |
-270 |
|
2034/35 |
695 |
697 |
10717 |
10449 |
630 |
-268 |
|
2035/36 |
674 |
697 |
11391 |
11146 |
615 |
-245 |
|
2036/37 |
637 |
697 |
12028 |
11842 |
604 |
-186 |
|
2037/38 |
635 |
697 |
12663 |
12539 |
572 |
-124 |
|
2038/39 |
572 |
697 |
13235 |
13235 |
0 |
0 |
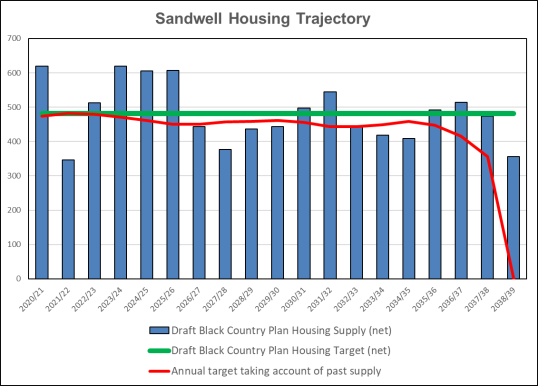
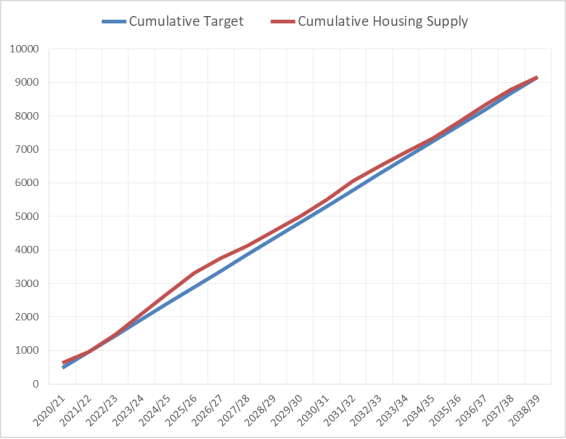
4) Sandwell Housing Trajectory
|
Year |
Draft Black Country Plan Housing Supply (net) |
Draft Black Country Plan Housing Target (net) |
Cumulative Housing Supply |
Cumulative Target |
Annual target taking account of past supply |
Variation from Cumulative Target |
|
2020/21 |
619 |
482 |
619 |
482 |
474 |
-137 |
|
2021/22 |
346 |
482 |
965 |
964 |
482 |
-1 |
|
2022/23 |
513 |
482 |
1478 |
1446 |
480 |
-32 |
|
2023/24 |
620 |
482 |
2098 |
1928 |
471 |
-170 |
|
2024/25 |
606 |
482 |
2704 |
2410 |
461 |
-294 |
|
2025/26 |
607 |
482 |
3311 |
2892 |
450 |
-419 |
|
2026/27 |
443 |
482 |
3754 |
3374 |
450 |
-380 |
|
2027/28 |
377 |
482 |
4131 |
3856 |
457 |
-275 |
|
2028/29 |
436 |
482 |
4567 |
4338 |
459 |
-229 |
|
2029/30 |
444 |
482 |
5011 |
4820 |
461 |
-191 |
|
2030/31 |
498 |
482 |
5509 |
5302 |
456 |
-207 |
|
2031/32 |
544 |
482 |
6053 |
5784 |
444 |
-269 |
|
2032/33 |
442 |
482 |
6495 |
6266 |
444 |
-229 |
|
2033/34 |
418 |
482 |
6913 |
6748 |
449 |
-165 |
|
2034/35 |
409 |
482 |
7322 |
7230 |
459 |
-92 |
|
2035/36 |
492 |
482 |
7814 |
7712 |
448 |
-102 |
|
2036/37 |
514 |
482 |
8328 |
8194 |
415 |
-134 |
|
2037/38 |
474 |
482 |
8802 |
8676 |
356 |
-126 |
|
2038/39 |
356 |
482 |
9158 |
9158 |
0 |
0 |
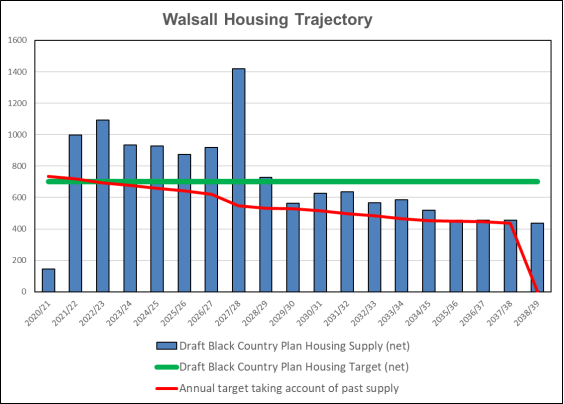
5) Walsall Housing Trajectory
|
Year |
Draft Black Country Plan Housing Supply (net) |
Draft Black Country Plan Housing Target (net) |
Cumulative Housing Supply |
Cumulative Target |
Annual target taking account of past supply |
Variation from Cumulative Target |
|
2020/21 |
146 |
702 |
146 |
702 |
733 |
556 |
|
2021/22 |
996 |
702 |
1142 |
1405 |
718 |
263 |
|
2022/23 |
1094 |
702 |
2236 |
2107 |
694 |
-129 |
|
2023/24 |
935 |
702 |
3171 |
2809 |
678 |
-362 |
|
2024/25 |
928 |
702 |
4099 |
3512 |
660 |
-588 |
|
2025/26 |
874 |
702 |
4973 |
4214 |
644 |
-759 |
|
2026/27 |
919 |
702 |
5892 |
4916 |
621 |
-976 |
|
2027/28 |
1418 |
702 |
7310 |
5618.4 |
549 |
-1692 |
|
2028/29 |
728 |
702 |
8038 |
6321 |
531 |
-1717 |
|
2029/30 |
562 |
702 |
8600 |
7023 |
527 |
-1577 |
|
2030/31 |
627 |
702 |
9227 |
7725 |
515 |
-1502 |
|
2031/32 |
637 |
702 |
9864 |
8428 |
497 |
-1436 |
|
2032/33 |
567 |
702 |
10431 |
9130 |
485 |
-1301 |
|
2033/34 |
585 |
702 |
11016 |
9832 |
466 |
-1184 |
|
2034/35 |
520 |
702 |
11536 |
10535 |
452 |
-1002 |
|
2035/36 |
457 |
702 |
11993 |
11237 |
450 |
-756 |
|
2036/37 |
457 |
702 |
12450 |
11939 |
447 |
-511 |
|
2037/38 |
457 |
702 |
12907 |
12641 |
437 |
-266 |
|
2038/39 |
437 |
702 |
13344 |
13344 |
0 |
0 |
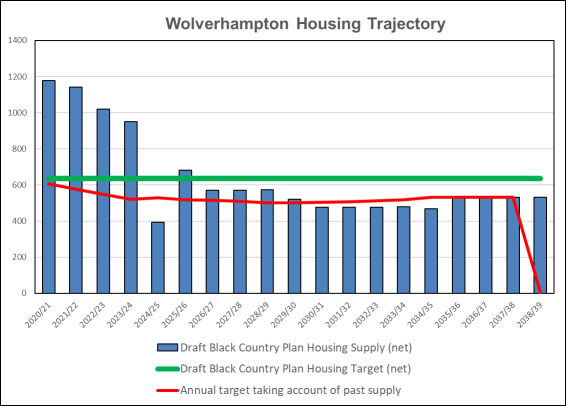
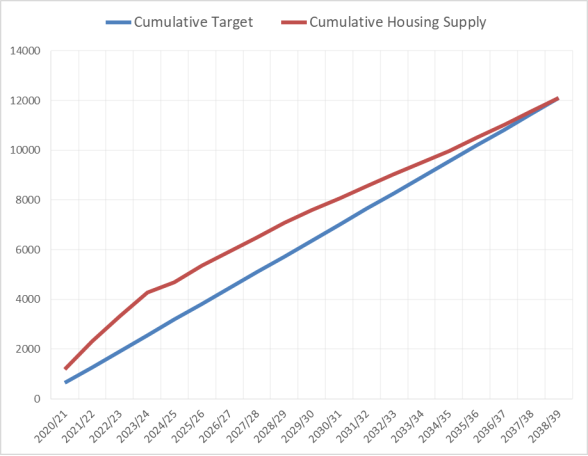
6) Wolverhampton Housing Trajectory
|
Year |
Draft Black Country Plan Housing Supply (net) |
Draft Black Country Plan Housing Target (net) |
Cumulative Housing Supply |
Cumulative Target |
Annual target taking account of past supply |
Variation from Cumulative Target |
|
2020/21 |
1177 |
637 |
1177 |
637 |
607 |
-540 |
|
2021/22 |
1141 |
637 |
2318 |
1274 |
575 |
-1045 |
|
2022/23 |
1019 |
637 |
3338 |
1911 |
548 |
-1427 |
|
2023/24 |
949 |
637 |
4287 |
2547 |
521 |
-1739 |
|
2024/25 |
392 |
637 |
4679 |
3184 |
530 |
-1495 |
|
2025/26 |
681 |
637 |
5360 |
3821 |
518 |
-1539 |
|
2026/27 |
572 |
637 |
5932 |
4458 |
514 |
-1474 |
|
2027/28 |
572 |
637 |
6503 |
5094.8 |
509 |
-1409 |
|
2028/29 |
573 |
637 |
7076 |
5732 |
502 |
-1345 |
|
2029/30 |
522 |
637 |
7598 |
6369 |
500 |
-1229 |
|
2030/31 |
477 |
637 |
8075 |
7005 |
503 |
-1069 |
|
2031/32 |
477 |
637 |
8551 |
7642 |
507 |
-909 |
|
2032/33 |
477 |
637 |
9028 |
8279 |
512 |
-749 |
|
2033/34 |
478 |
637 |
9506 |
8916 |
519 |
-590 |
|
2034/35 |
468 |
637 |
9974 |
9553 |
532 |
-421 |
|
2035/36 |
531 |
637 |
10505 |
10190 |
532 |
-315 |
|
2036/37 |
531 |
637 |
11036 |
10826 |
532 |
-210 |
|
2037/38 |
531 |
637 |
11567 |
11463 |
533 |
-104 |
|
2038/39 |
532 |
637 |
12100 |
12100 |
1 |
1 |